
 Deutsch
 English

Lean Canvas Part II - Business Modeling in Practice
In Part I of the series on the Lean Canvas, the tool is described as a kind of Google Maps for founders. In that context, particular emphasis was placed on the aspects of planning. Part II now focuses on execution—that is, the actual navigation.
Google Maps for Your Startup Project
Once the ideal route from the starting point to the destination has been mapped out, the trip can begin. The Google Maps user gets into their car and lets the app guide them along the route. But what happens in the event of a traffic jam? The route changes. Google Maps adjusts its route planning based on traffic conditions to ensure you still reach your destination via the best possible route.
At this point, we draw a connection back to the Lean Canvas. The underlying philosophy (Lean Startup) aims to help founders navigate an environment of high uncertainty. To achieve this, the initial plan is continually adjusted and realigned with the goal, much like a GPS device.
The benefit of the Lean Canvas (and the underlying philosophy) in the context of a startup, therefore, lies in maximizing value for customers while simultaneously minimizing the use of resources.
From Assumptions to Validated Knowledge
As mentioned at the beginning, one of the most important features of the Lean Canvas is that it brings together all relevant aspects on a single page in a short amount of time. A valuable side effect is that it helps avoid time-consuming over-planning. By writing down simple assumptions about customer problems and the like, you capture the intuition of the person in charge. This intuition is, in a sense, the counterpart to the intense and drawn-out planning process, which isn’t wrong in and of itself but often overshoots its mark. But is the intuitive assumption always correct? Hardly. This is where the added value of the Lean Canvas becomes apparent in the startup process: it helps to systematize intuition. As the project progresses, the initial assumptions are refined into validated knowledge.
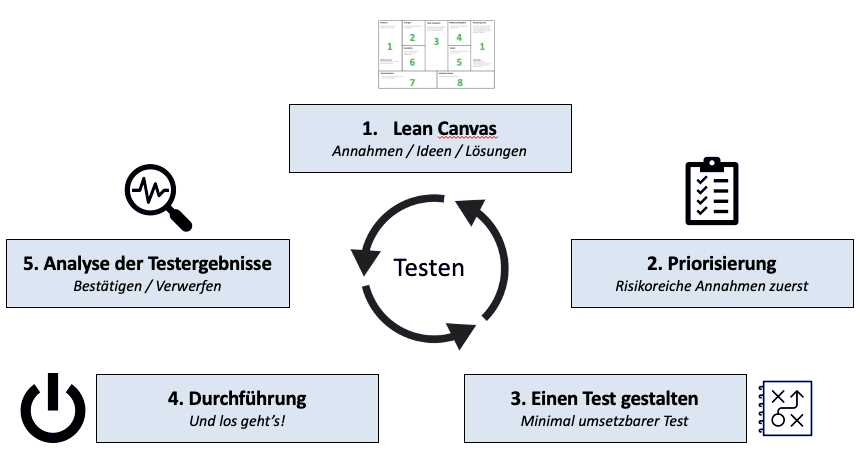
Assumption Validation Cycle
To achieve the validation discussed above, every relevant assumption made during project planning is tested. The following figure shows a cycle in which the Lean Canvas (and its assumptions) comes first, followed by a call to prioritize.
The “highest-risk” assumptions should be tested first. These are the ones related to customer segments and problems. If these are uncertain or even incorrect, the entire project rests on very shaky ground. Next in line are the proposed solutions, which should be considered the highest-risk. Further prioritization can now be derived from the corresponding order of the Lean Canvas (see Part I. It should be noted again at this point that this order is not universally applicable).
The third step focuses on designing an experiment. Here, two fundamental questions
are addressed:
What do I want to learn?
What have I learned?
The test must therefore be designed from the outset to address the underlying assumption (1. What do I want to learn?) and, furthermore, to provide opportunities for analysis using key metrics (2. What have I learned?). Consequently, criteria for confirming or rejecting the assumption are first established. In addition, the most important observations are recorded, and the next steps are derived from the test results.
To measure progress, appropriate metrics must be identified and tracked. But what does a suitable metric look like? What requirements must it meet? To answer these questions, we’ll discuss the difference between “cosmetic” and “relative” metrics.
“Cosmetic” metrics show absolute values. They bear no relation to actual performance and therefore do not provide a sound basis for decision-making. One example is the metric “number of new customers.” 500 new customers! This number alone can look very impressive. However, it says nothing about the circumstances under which it was achieved. How much time was allocated? How many employees were involved? How high are the marketing costs? It becomes clear that the value alone says nothing about the performance delivered and can therefore quickly be misleading.
In contrast, there are relative metrics. As the name suggests, these are figures that compare at least two values. To stick with the example mentioned, we can now divide the number of new customers by the number of sales employees. This gives us the number of new customers per employee. This figure can also be applied to a specific time period, for example, to highlight any seasonal effects. The relative metric allows us to directly assess the performance achieved.
After completing this step (Step 4), the results can now be analyzed in Step 5 based on the previously defined metrics.
Transition Back to the Lean Canvas
Once the relevant hypothesis has been successfully tested, the new insights (or confirmation of the old ones) are incorporated into the Lean Canvas. In this way, you gradually work your way from a customer problem to a value-adding solution that is documented and reproducible.
Published on May 28
, 2021 Author: Marcel Heine